Brief OverviewKinematics: In this unit, we learned how time correlated to position, velocity, and acceleration. We studied the motion of an object itself, rather than the forces involved with the motion. We interpreted position-time graphs, velocity-time graphs, and acceleration-time graphs. Through analyzing these graphs, we were able to derive key properties of an object in motion, such as displacement, initial position, initial velocity, and acceleration. We also analyzed the motion of a projectile, meaning an object that is moving in the air.
|
|
Terminology:Position (X) refers to the changes in the location of the object on a coordinate plane depending on time.
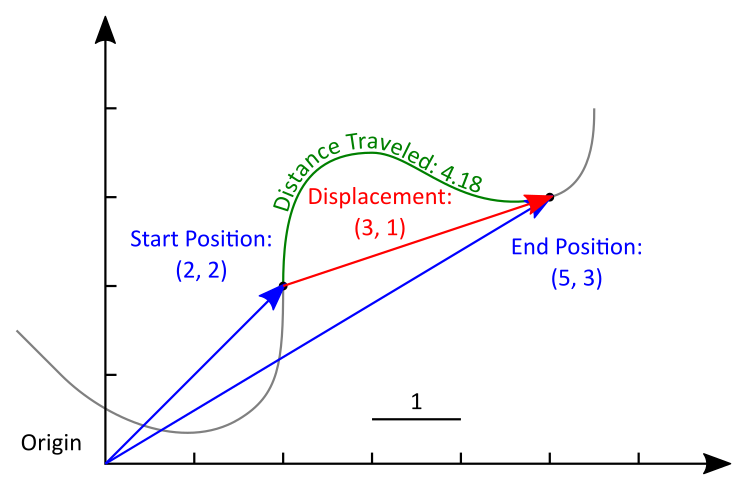
Distance (d) refers to how far the object has traveled, regardless of the direction it travels in. This number is always positive. Displacement (Δx) refers to the overall change in position of the object, including the direction. Calculated as (xfinal - xinitial) |
|
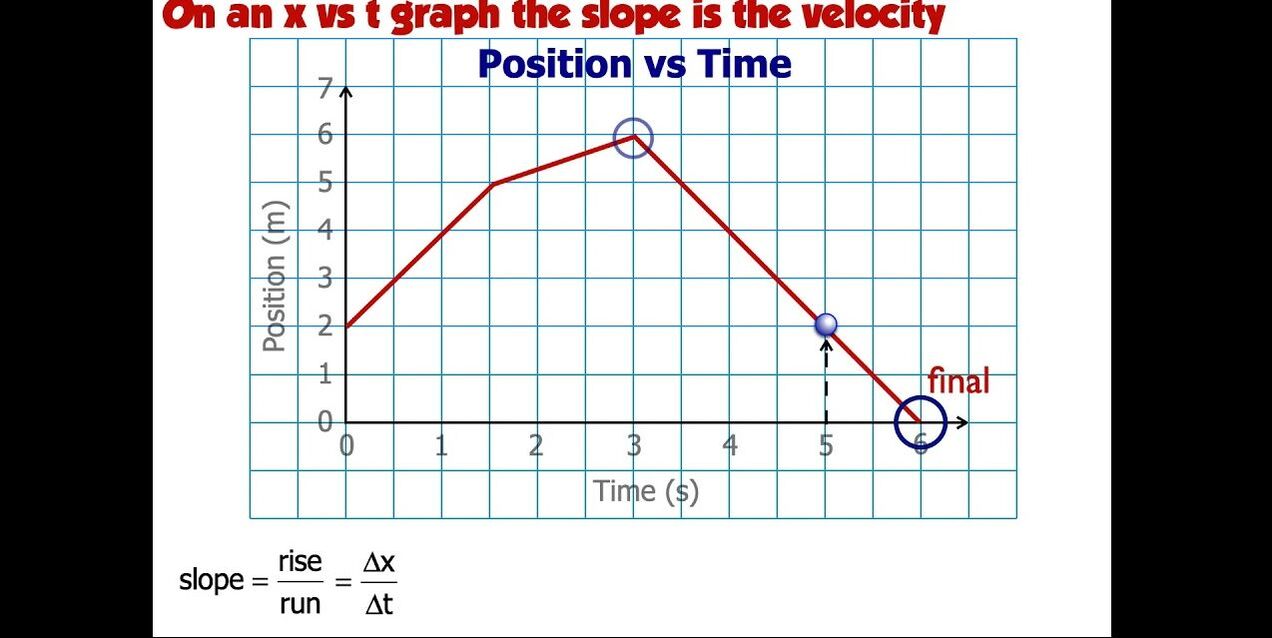
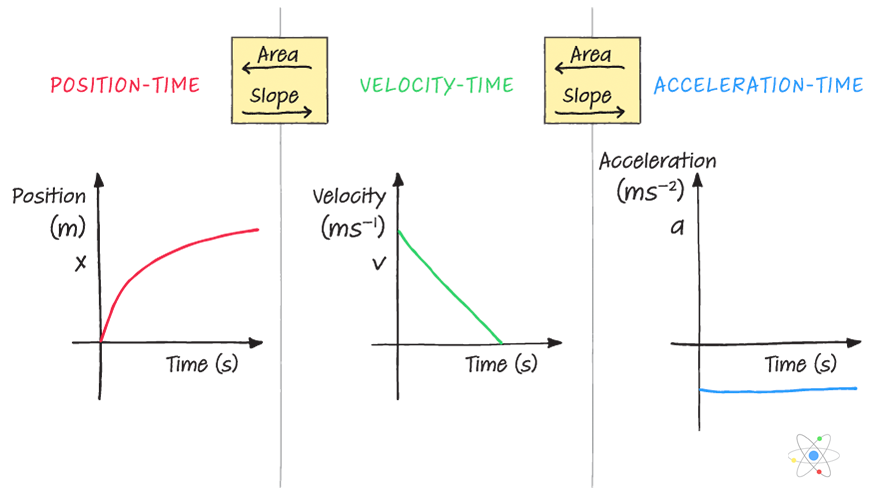
Interpreting Position-Time Graphs:The values on the x-axis of a Position-Time graph represents time. The values on the y-axis of a Position-Time graph represents position. The change in position, also known as the displacement, is calculated by subtracting the initial x value from the final x value. The distance is determined by calculating the length of the graph of position vs. time. The velocity is the slope of the Position-Time graph, and the sign of the slope determines what direction the object is moving in. The speed of the Position-Time graph is shown through the steepness of the slope. The steeper the slope, the faster the object. The y-intercept is the initial position of the object.
Represented as X(t)=V*Δt+Xi |
|
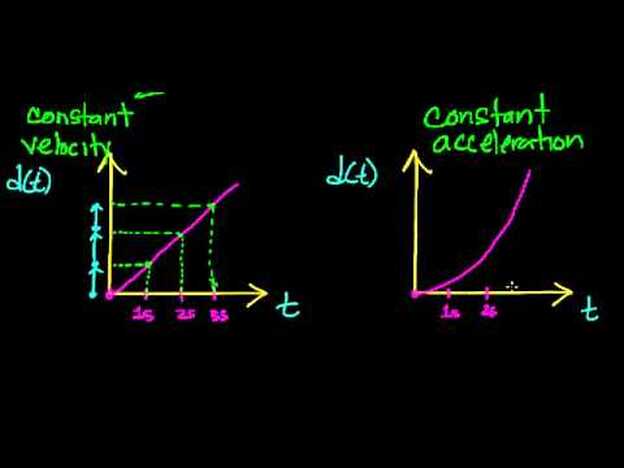
Determining Velocity and Speed from a Position-Time Graph:You can determine the velocity from a Position Time graph by taking the slope of the graph. If the Position-Time graph is linear, your velocity will be a constant number. If the Position-Time graph is curved, you take the derivative of the Position-Time equation to determine the velocity formula (taking the derivative of the linear graph will also get you the right answer). Either way, it is the slope of the Position-Time graph.
You can determine the speed from a Position-Time graph by looking at the steepness of the slope (aka the velocity). The slope is steeper when the absolute value of the slope is farther away from zero. When the slope is less than 1, and gets closer to 0, the slope gets shallower, showing a decreasing speed. The sign of this slope will tell you what direction you are going. |
|
Interpreting Velocity-Time Graphs:The Velocity-Time graph shows the change in velocity with respect to time. The values of the x-axis of a Velocity-Time represents time. The values of the y-axis of a Velocity-Time graph represents the velocity of the object. The y-intercept of the Velocity-Time graph represents the initial velocity of the graph. The slope of the Velocity-Time graph represents the acceleration of the object in respect to time. The steepness of the slope shows how fast the speed changes, while the sign determines the direction. The change in velocity is shown by subtracting the V initial from the V final value.
|

|
Determining Accelerating and Starting Velocity from a Position-Time Graph:From a Position-Time Graph, we can determine the acceleration of the object. To do this, we first need to find the slope of the Position-Time graph. We do this by taking the derivative of the function (or simply counting depending on if it is linear). This number/equation that we get is the velocity of the object. We then need to find the slope of the velocity-time equation to find the acceleration. We take the derivative again to get a number/equation that is the acceleration of the object.
From a Position-Time graph, we can determine the starting velocity of the object. To do this, we first take the derivative of the Position-Time graph in order to find the Velocity-Time graph. Once we find this equation, we plug in the initial time value (typically 0) into the Velocity-Time graph. This will then give us the starting velocity of the object. |

|
Determining Position, Distance, and Displacement from a Velocity-Time Graph:Using the Velocity-Time graph, we can calculate the position, distance, and displacement of the object. If we multiply the initial velocity and the change in time, and add ½ multiplied by the acceleration and change in time squared, we get Δx, also known as the displacement of the object. If we take the antiderivative of the Velocity-Time graph, we get the Position-Time graph. We can then plug in values of time to get our position. To find the distance, we simply calculate the length of the Position-Time graph equation that we just derived.
|
|
Connecting Representations of Motion: x-t graphs, v-t graphs, strobe diagrams etc.Strobe diagrams give a very good visual representation of the direction of an x-t graph. The strobe graphs do a very good job of showing time and direction clearly. Time and direction are also shown in the x-t graph and the v-t graph. The v-t graph is simply a representation of the slope of the x-t graph, as the slope of the position-time graph is velocity. The direction of the object is shown in the sign of the slope of the x-t graph, and the sign of the y-values for the y-t graph. An a-t graph also shows the slope of the v-t graph, which is the acceleration. All of these share information about the motion of the object in different ways, and all are helpful for their own purposes.
|
|
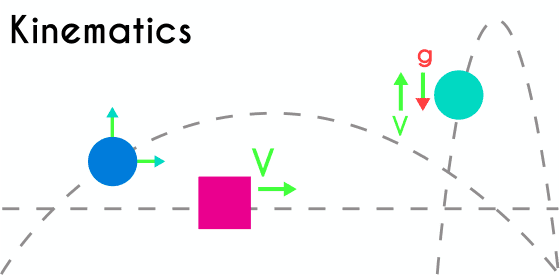
Solving Problems using Constant Velocity and Uniform Acceleration Models:Constant velocity defines the X motion of a projectile. This is how far the projectile goes once in the air. Uniform acceleration defines the Y motion of a projectile. This is how long the projectile is in the air before hitting something. Both the constant velocity and uniform acceleration are determined by the change of time in relation to the change in position, velocity, and acceleration.
|
|
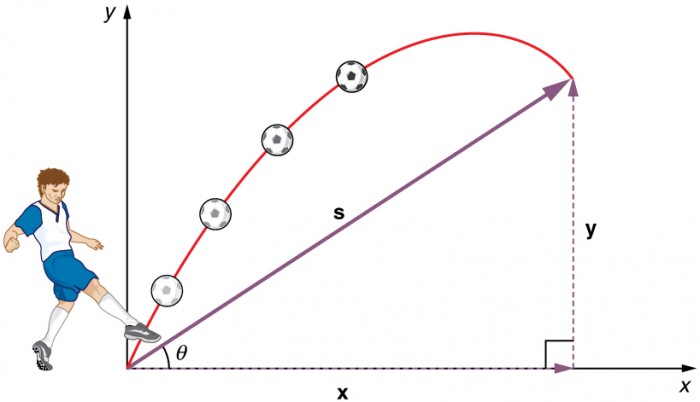
Projectile Motion:A projectile is defined as an object in the air, not “touching” the air. The projectile has two motions: horizontal motion and vertical motion. The horizontal motion, known as the X motion, describes how far the projectile is moving. The vertical motion, known as the Y motion, describes how long the projectile stays in the air. A projectile’s position graph begins when the object is put into the air, and then ends when the object hits something else (i.e. the floor). Projectile motion can be seen through kinematic equations as well as video analysis.
|
|
