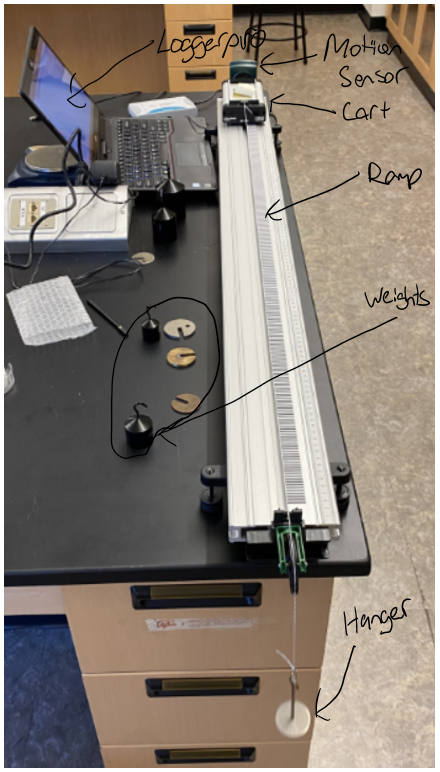
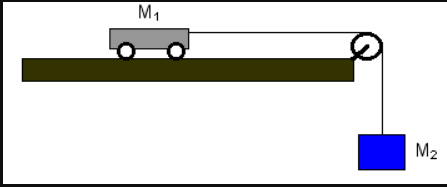
Labeled Diagram |
|
Experiment 1 Variables:Independent Variable: Net Force
Dependent Variable: Acceleration Controlling Variable: Mass of the cart |

|
Experiment 1 Method for Collection and Procedure:To collect the data, we used a motion detector which would send out soundwaves to calculate the position of the cart on the ramp. These data entries would then be recorded by LoggerPro, and made into a position-time graph. From there, we could create a velocity-time graph, and take the slope of that graph, giving us the acceleration of the cart.
To increase the net force while keeping the mass of the cart constant, we would need to decrease the mass of the cart while increasing the mass of the hanger, while keeping the total combined mass of the hanger and the cart the same. |
|
Experiment 1 Raw Data:
|
|
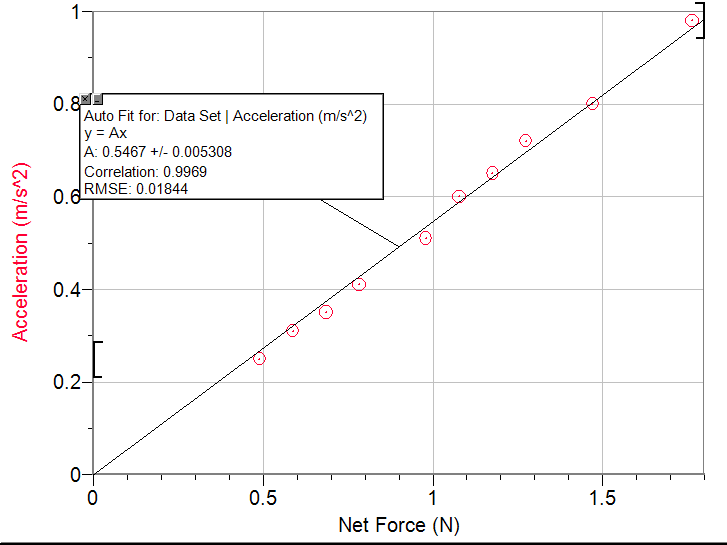
Experiment 1 Processed Data:Formula: Predicted Acceleration = 0.5467 (Net Force)
Slope: For every 1 Newton increase in net force, the predicted acceleration increased by 0.5467 m/s^2. Y-Int: The y-intercept is just 0 here, because there is no acceleration when there is no net force acting upon the object. |
|
Experiment 2 Variables:Independent Variable: Total Mass of System
Dependent Variable: Acceleration Controlling Variable: Net Force |

|
Experiment 2 Method for Collection and Procedure:To collect the data, we used a motion detector which would send out soundwaves to calculate the position of the cart on the ramp. These data entries would then be recorded by LoggerPro, and made into a position-time graph. From there, we could create a velocity-time graph, and take the slope of that graph, giving us the acceleration of the cart.
To increase the net force while keeping the acceleration constant, we would need to increase the mass of the cart, while keeping the mass of the hanger the same, thereby increasing the total combined mass of the hanger and cart. |

|
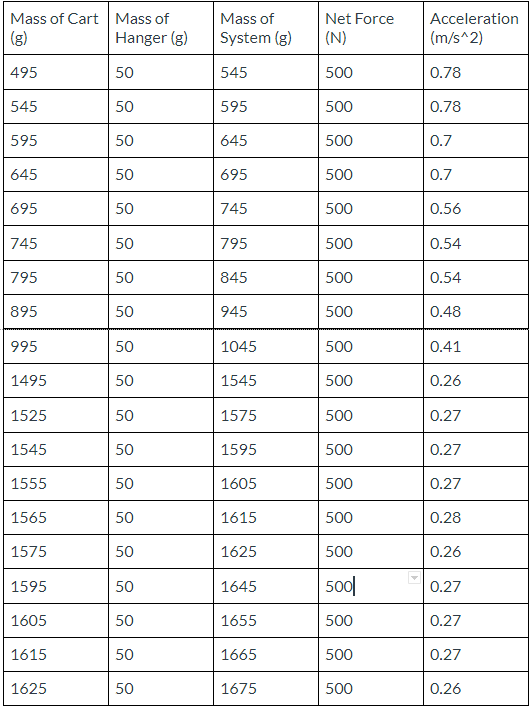
Experiment 2 Raw Data: |
|
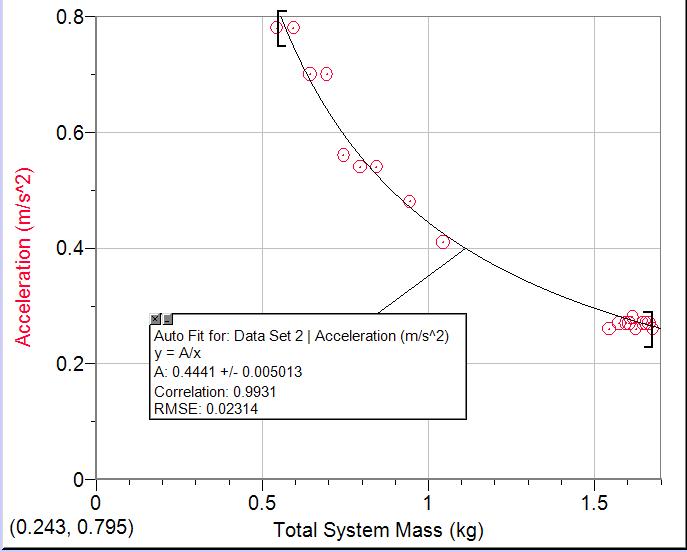
Experiment 2 Processed Data:Formula: Predicted Acceleration = 0.441/Total System Mass
Slope: The slope is becoming flatter as the mass increases, meaning it is moving closer and closer to 0. This means that as the mass increases, the acceleration decreases exponentially. Y-Int: There is no y-intercept here because the total mass of the system can never be 0, otherwise there would be no system. |
|
Joint Conclusion:When evaluating the data for both experiments, we were able to come to a conclusion about the relationship between acceleration, mass, and net force.
In the first experiment, we observed a positive, approximately linear relationship between the net force and the acceleration. This means while holding the mass constant, as net force increased, the acceleration did as well. When we added mass to the hangers, the cart accelerated linearly. This is shown by our equation for the acceleration: Predicted acceleration = 0.5467(Net Force). For every 1 Newton increase in net force, the acceleration increased by 0.5467 m/s^2. In the second experiment, we observed a negative, inverse function relationship between mass and acceleration. While keeping the net force constant, as the mass decreases, the acceleration increases exponentially until the mass hits 0. As the mass of our cart and hanger system decreased, the acceleration of the cart increased. This is shown by our equation for the acceleration: Predicted acceleration = 0.4441/(Mass). The acceleration decreased exponentially as the mass increased. From these two experiments, we can conclude that by increasing the mass and keeping the acceleration constant, the net force stays the same. Additionally, by increasing the acceleration and keeping the mass constant, the net force decreases. Newtons can be rewritten as (kg)(m/s^2), so when plugging that into our acceleration equation: acceleration = ((kg)(m/s^2))/kg. So acceleration = (1/total mass)(Net force) = (Net Force)/(Total Mass). This can be rewritten as the net force formula, which is Net Force = (Acceleration)(Mass). |
|
Evaluating Procedure and Improving the Investigation:The two most significant sources of uncertainty in the lab were the limited range of weights available, and the number of trials performed. With only a few weights, we could only change our data entries by so much. This means we didn’t have the largest range of data to prove that our equations could be applied as a generality. To fix this, we could have worked with more weights to create a much larger range of data, giving us more accurate results that can be generally applied. In addition, for each data point, we only did one trial. This could mean that we had some error in our data collection that would not yield the same results. If we had multiple trials, we could rule out the possibility of error, however unlikely it may be. Doing multiple trials would create a larger sense of reliability in our data.
|

|
